LET THE GOOD TIMES ROLL
The Australian budget is being buoyed by cyclical factors, but is in structural deficit
My last post showed that the cyclically adjusted estimates imply the May Budget was slightly contractionary. That post also noted that “a comparative analysis of Treasury’s methodology to derive these estimates with the Parliamentary Budget Office’s approach” would be useful.
Both institutions outlined their methodologies in working papers published a decade ago. This post is a quick compare and contrast of the two methods.
The first step in deriving the structural budget balance is to estimate the output gap. Let’s unpack what the output gap is, and how the two institutions go about estimating it.
In the long run, economies grow because the number of workers grow and/or workers become more productive. The long run — that is, after abstracting from the influences of the business cycle — growth in these two factors determine the trend or potential growth rate in an economy.
Productivity grows over time because of a rise in capital per worker as well as through increases in the efficiency with which both capital and labour are utilised in the production process. The PBO explicitly accounts for the role of capital in the production process. Treasury doesn’t. It turns out that this makes little difference to their estimates.
Long-term growth in labour input depends on the demography, social factors that determine people’s participation in the labour market. The two institutions use broadly similar methods in estimating these factors.
During a recession or an economic slowdown, the economy deviates from this trend growth path, and output is lower than might have been potentially attained if not for the slowdown. As the economy recovers, it catches up to the potential level. During this recovery process, the economy grows at a faster pace than the trend rate. Then during the late stage of the business cycle, the economy might be operating above the potential level, with demand outpacing supply and inflation ensuing.
The difference between the actual output and the potential one is the output gap. If it is negative, then the economy is below potential, and when it is positive, the economy is above potential. If the output gap is becoming a bigger negative number (or a smaller positive number), then the economy is growing at a slower pace than the potential. When the output gap is becoming a smaller negative number (or bigger positive number), the economy is growing at a faster-than-trend clip.
When the output gap is close to zero — that is, the economy is near its potential path — the labour market is said to be at the ‘full employment’ level. At such times, the rank of the unemployed mainly reflects personal idiosyncratic factors and not the broader macroeconomic forces that drive recession.
Both Treasury and the PBO assume that full employment means 5% unemployment rate. Or more precisely, the non-accelerating inflation rate of unemployment (NAIRU) in Australia was estimated by both institutions to be about 5%. This compares with the recent observation by the RBA Deputy Governor that NAIRU might be at around 4½%.
Let me take a slight detour here. Back in 2008, Malcolm Turnbull asked Wayne Swan in Parliamentary Question Time about Australia’s NAIRU. If Treasurer Chalmers gets asked a similar question as this, well, you read it here first:
Since the Budget’s structural balance chart refers to the 2013 Treasury Working Paper, and since that paper has not been updated, does it mean Treasury considers unemployment will need to rise to 5% to contain inflation?
Okay, I jest. It is very difficult to estimate NAIRU with any precision. This deserves its own post. For now, let’s get back to the structural budget balance.
The Treasury estimates are somewhat less complicated than PBO’s, but both suggest that the economy was operating slightly above potential — that is, a slightly positive output gap —before the Global Financial Crisis. This is hardly a controversial claim.
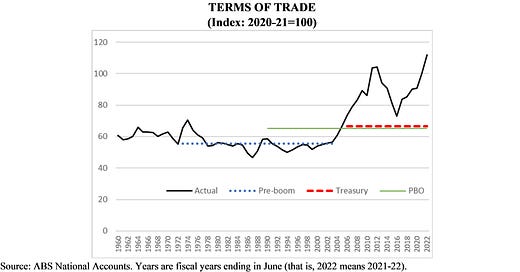
The second step in estimating the structural budget balance is to assume a long-run ‘structural’ level of the Terms of Trade, which measures the price of Australian exports relative to that of its imports. A high Terms of Trade means more aggregate income, all else equal. The Treasury assumption is that over the long-term, the ‘structural’ Terms of Trade reflect:
· the average between 1972-73 to 2001-02 for that period (the pre-boom period);
· the actual Terms of Trade observed between 2002-03 and 2005-06;
· 20% higher than the average over the pre-boom period.
That is, Treasury assumption is that in the long-run the Terms of Trade is 20% higher than what was observed in the last three decades of the 20th century. The PBO assumes that the lower bound for the long-term structural Terms of Trade is the average over the period 1989-90 to 2011-12. The chart below shows that there isn’t much of a difference between the two institutions’ assumptions.
The chart also shows the elevated Terms of Trade relative to these long term ‘structural’ assumptions. That is, with unemployment at generations low, and the Terms of Trade at the stratosphere, it has indeed been a good time for Australians’ incomes (wait — what about the inflation, okay, yes, well, another post).
Of course, higher incomes mean more taxes. Over two-thirds of the Commonwealth Government tax receipts come from incomes earned by individuals and companies. If the economy is operating at above potential (as implied by unemployment rates that are much lower than the NAIRU estimates) and the Terms of Trade is higher than the structural level, then clearly a part of the incomes and the tax revenues derived from them reflect the current good times.
Stripping out this part from the budget balance is the third step in deriving the structural budget balance.
Following an OECD study from 2005, Treasury assumes that there is an elasticity of 1¼ between output gap (and income gap represented by the difference between actual and the assumed structural Terms of Trade) and taxes. That is, for each 1% change in the output (and the income gap), tax revenue is assumed to change by 1¼%. While Treasury considers all taxes except Capital Gains Tax in aggregate, PBO estimates the impact of the output and income gaps in detail by each type of tax. The PBO method is obviously more complex, but derives similar results as Treasury’s.
Recognising the difficulty (impossibility?) of estimating any structural level of asset prices, both assume that decadal average of the ratio of CGT revenue to GDP represent the ‘structural level’ of CGT revenue.
And with the 5% NAIRU assumption, both derive similar estimates of the expenditure on unemployment benefits —the only cyclical component of the expenditure.
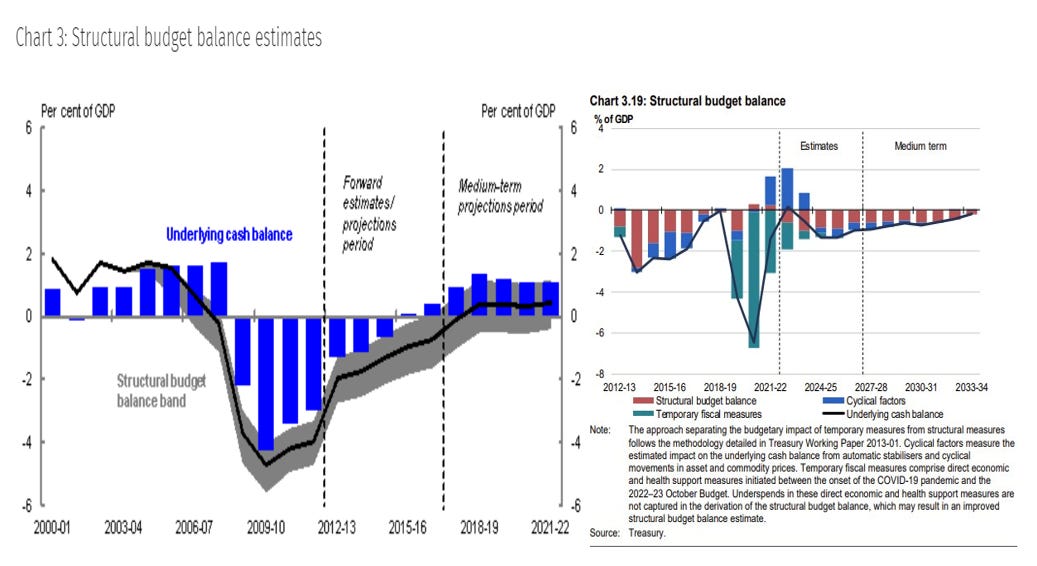
Putting these together yield the ‘cyclically adjusted’ budget balance. According to Treasury, these cyclical ‘good times’ added 2% of GDP to the budget balance in 2022-23.
To gauge whether a budget is expansionary —that is, adding to aggregate demand— one needs to consider how this cycliclically adjusted estimate is evolving over time (as was done in the previous post). But structural budget balance is also a metric of whether current policy settings are sustainable over the long term. For that purpose, one needs to adjust for the temporary measures such as fiscal support provided during the pandemic —that is the final step.
Once all of that is done, we have the chart that was posted previously and is reproduced below (right). And according to this estimate, the Australian budget has been in structural deficit for much of the past decade, and will likely to remain so for much of the next. For those interested in historical curiosities, the deterioration in the structural balance started in the 2000s, before the financial crisis (shown in left, copied from the 2013 Treasury Working Paper).
It would be interesting to compare Treasury projections of structural budget balance from a decade ago with their latest estimates. But sadly, the underlying data does not seem to be available. As for the PBO, they haven’t updated their estimates over the past decade. They have released a new report on Australia’s long-term fiscal sustainability, and the term ‘structural budget balance’ does not even appear there.
Okay, so what does all this mean?
Does Australia have long-term fiscal sustainability problem because Treasury estimates a structural budget deficit for the rest of the decade? For what its worth, PBO says ‘no’ —the report is pretty cool and we will write about it in future.
For now though, let the good times continue to roll.
Further reading (not necessarily related to the post, and may or may not lead to future post(s)).
Macroeconomics is still in its infancy
A lot of ideas; not a lot of conclusions.
Noah Smith, 8 Nov 2022
Robert Lucas, economist, 1937-2023
A master model-builder who took on the Keynesians and reinvented his discipline
Delphine Strauss, 20 May 2023
Why rising interest rates have not yet triggered property pandemonium
Economist, 12 June 2023
Manufacturing is undergoing a revival around the world, sending several secular trends into reverse
Andy Haldane, 26 June 2023
Kyla Raby and Nerida Chazal, 27 June 2023


