


YOUNGBLOOD
How to make the next Intergenerational Report relevant for the next generation

The Australian Government will publish an Intergenerational Report (IGR) no later than May 2024, the sixth installment in the series since its birth in 2002.
I always thought that an IGR should inform debate about the fair distribution of tax burden and welfare payments across generations. If it doesn’t speak to the distribution of income and wellbeing across generations — and it hasn’t to date — then what does it do that is intergenerational?
Two decades after inception, it is appropriate to ask: what has it done lately?
There have been two big changes since the 1990s
The IGR is required by the Charter of Budget Honesty Act to set out the long-term sustainability of the policies of the Government of the Day. Sustainability of fiscal policy provides the base from which Australia pays for the the things that matter, like Medicare, Age Pensions, Disability Support Pensions, NDIS, Australian Defence Force and so forth. A worthy cause, without doubt.
The Act was a response to John Howard and Peter Costello’s shock of a budget Black Hole they inherited after the 1996 election — amounting to about 3 1/2 % of GDP at the time — not previously disclosed in the former Keating Government’s budget paper.
Back in the early 1990s, 2 years of budget numbers were projected. Now budget papers include all of the detail of individual measures for 4 years, and 10-year projections have been integrated into the papers for major items. Projections of the underlying cash balance to 2033-34 were included in the most recent papers, including payments and receipts in aggregate, together with detail on payments by major group (health, individuals, aged care, age pension, NDIS, defence, interest and other payments) as well as net debt.
That is, to the extent that the purpose of the IGR is merely to comment on fiscal sustainability, that purpose has been cannibalised by medium-term projections within budget papers in much the same way that one-day international cricket has been cannibalised by the T20 format: delivering a benefit to society overall, but also a need to reconsider how best the IGR can create public value going forward.
The Act also requires the publication of a Pre-Election Economic and Fiscal Outlook (PEFO) signed off by the Secretaries of Finance and The Treasury — whom are public servants — rather than being documents signed off by the Government of the Day. The power of the Act lies not merely in the PEFO itself, but in the fact that any government would need to explain during an election campaign why its most recent budget projections vary from the independent PEFO forecasts, forcing a degree of truth in budget production throughout the electoral cycle. This is the Act’s most powerful lever to deliver public value. The IGR is, by contrast, not independent of Government.
So what is the value of future Intergenerational Reports?
Some early success
The first IGR in 2002 led to, or at least supported, policy changes.
The first report paved the way to establish the Future Fund, which will pay out liabilities of Commonwealth employee defined benefit superannuation schemes, and to close these schemes to new members. These were substantial steps to make the generation that benefited from the public services delivered by these employees to also pay for their pensions, in a similar way that other workers have employers contribute to their super as they work.
It also supported policy changes to make it financially viable for people at or approaching pension age to continue to work part-time.
Is it still relevant?
While it remains a tool for budget transparency, it’s fair to say that the IGR has been spinning its wheels for a while now in terms of informing policy decisions.
It would be hard to point to a policy decision in the past decade that stemmed from an IGR.
Curiously, even the central message that the ageing of the population will result in downward pressure on the fiscal balance and upward pressure on the net debt that future generations inherit has largely been lost as the document has become more-tightly politically controlled.
The long-term pressure on budgets, set out in 2002 and delayed partially by higher immigration in the 2007 and 2010 updates — driven by concrete estimates of health, Age Pension and aged care costs — have mysteriously disappeared. Despite the actual decline in fiscal balances and rise in net debt realised in the intervening years that have been far bleaker than the original IGR projected, the latest forecasts are far rosier. The recovery of IGR projections is ‘like Lazarus with a triple-bypass’, to thoroughly misquote John Howard.
Underlying Cash Balance Projections

Source: 2021 Intergenerational Report.
Commonwealth Government Net Debt Projections

Source: 2021 Intergenerational Report.
The independent views of academics and former public servants support this conclusion, as compiled by Andrew Podger, Jane Hall and Mike Woods. They found the 2021 IGR presented inadequate analysis of fiscal pressures (for example, omitting discussion of the structural deficit), and provided little or no analysis of revenue streams. Further, they found that it provided no clear agenda of policy issues that will impact on national wellbeing beyond those fiscal projections.
Treasurer Jim Chalmers (linked above) has pledged to make the next IGR less political and more impartial. A worthy statement. The proof of the pudding will be in the eating.
An independent IGR should set out the difficult challenges of the future in a way that supports a policy debate and eventual policy action — whether that is about climate change, immigration, housing, or education. And it should deal meaningfully with the risks to the fiscal projections of events like financial instability, pandemics and war … events that have severely affected fiscal outcomes in the past two decades. And it should inform a policy debate about the burden of future fiscal pressures on younger generations …
Putting the ‘G’ in IGR
The outlook for young Australians is one of the difficult challenges the next IGR should address.
Being a young adult isn’t all smashed avocadoes.
Young Australian adults take home a smaller share of income than their parents did at the same age.
Way back in 2001, when the inaugural IGR was a glint in Treasurer Peter Costello’s eye, on average 20 to 24 year olds earned 80% of the average income of all Australians. Today that figure is 60%. Meanwhile, those aged 35 to 64 year are taking home more.
(Wonknote: There are many ways to measure income, each with their strengths and weaknesses. This post focuses on Census data because it covers the entire population and income from all sources, but the trends set out are mirrored in other data sets. Census data present income within ranges, and for illustration within this post the mid-point of ranges is assumed.)
Personal income from all sources per person by age, % of Australian average
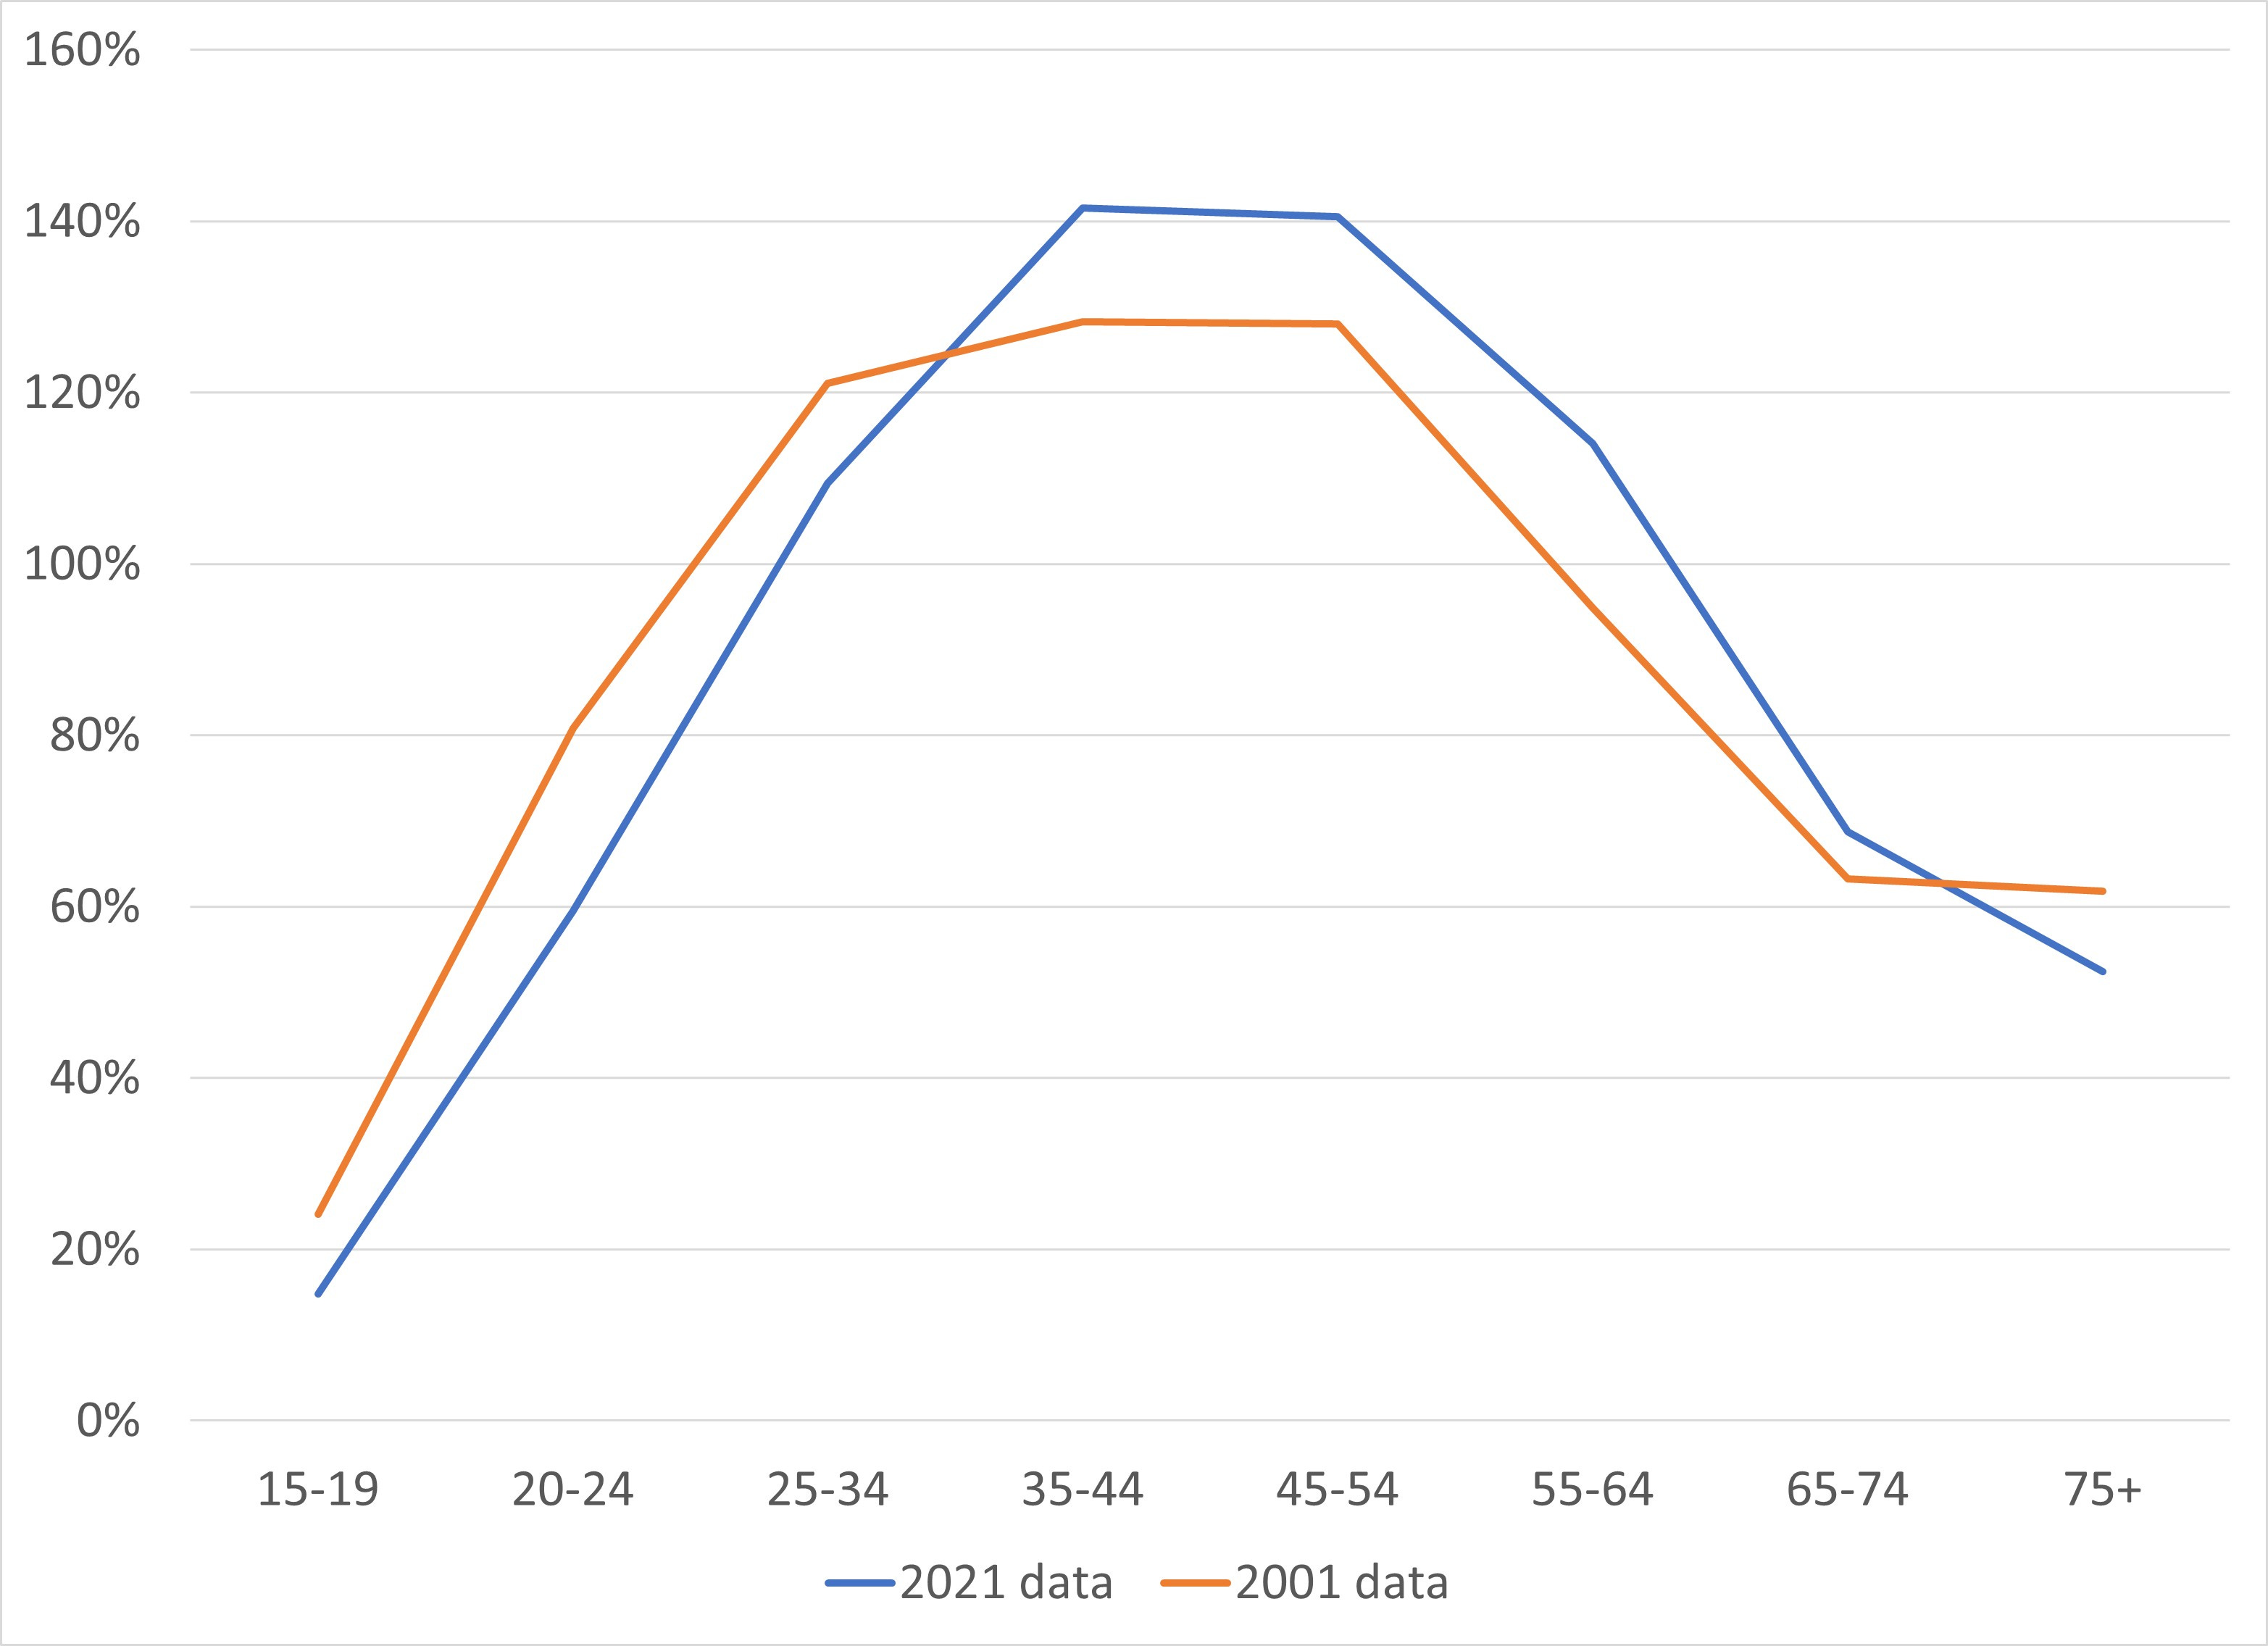
Source: 1hand calculations based on ABS Census of Population and Housing.
To make this concrete: in the counterfactual where young people were earning the same fraction of average national incomes as they did in 2001, their average earnings would have been between $115 and $264 higher per week in 2021.
Weekly personal income from all sources by age, $, 2021 vs 2001 counterfactual
Source: 1hand calculations based on ABS Census of Population and Housing.
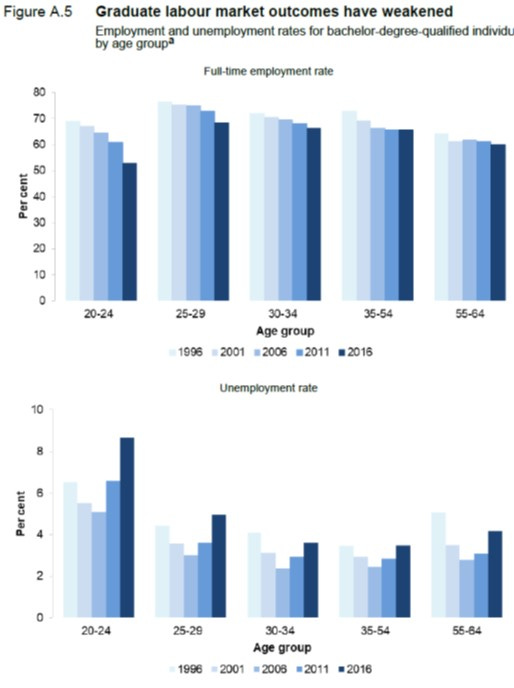
The causes are of course manifold. Young people are spending more time in education than ever before, for example. Yet the boost in employment outcomes from their years at university has fallen materially.
Source: Productivity Commission The Demand Driven University System: A Mixed Report Card

Another way to put this in perspective is to draw comparisons with Australian Government Net Financial Debt and house prices.
The table contains a lot of comparisons. But to continue the focus on 20-24 year olds, in the early 2000s (c.2002), it would take 21 years of work just to buy a house in Sydney, ignoring interest charges and taxes; that figure is now 33 years at their current wages.
Average earnings relative to house prices and government debt

Source: 1hand calculations based on ABS and Budget papers. All figures are nominal. Income is drawn from 2001 and 2021 census data; Final Budget Outcome debt figures are for 2001-02 and 2021-22; House price data are for December 2022 and December 2002.
Summing up
The generation younger than I am, those aged 20-24, face stronger headwinds in terms of generating wealth. Houses are more expensive to buy and more expensive to rent, they carry more university tuition debt and the pay-packet benefit of their studies has lessened. Meanwhile, they enter their careers with Commonwealth Government debt hanging over their heads.
Balancing the growing needs of older generations with those of the younger generations should be the story of the next Intergenerational Report.