

Give a man a Big Mac and you feed him for a day. Teach a man to cook and you feed him for a lifetime.
We are all looking for ways to eat more cheaply amid this cost of living crisis.
For Australian households, about 18% of expenditure was on food in 2022, essentially the same as the 17% they spent on food in 2000.
About 40% of this household food spend was on restaurant meals (23%) and fast food or takeaway (17%) in 2022. This is up from 27% of food expenditure in 2000 with the increase due to increased spending on restaurant meals (rising from 11% to 23% of food spending); fast food and takeaway held onto a constant share of the household food spend.
Which led me to investigate food pricing.
A Big Mac costs $7.55. Just for the burger. If you want fries with that and a coke then you are looking at $12.75.
This is not to criticise McDonalds. Quite the contrary. They provide a valuable service.
Rather, the Big Mac is interesting because it is largely the same two all-beef patties, special sauce, lettuce, cheese, pickles, onions on a sesame-seed bun that it was when the first store opened in Australia in 1971. Plus, McDonalds doesn’t appear to be making super-normal profits in Australia, nor gaining market share, so the prices they offer can be assumed to reflect the cost of production: ingredients, labour, capital and how productively they use them.
Let’s compare that with the three most frequently home-cooked meals in 2008 in Australia assuming a family of four. (If my household is any gauge, there ain’t nearly as much steak and veg being cooked these days given beef prices, but the comparison remains interesting.) Prices are current based on recipes published by, and fulfilled by, Woolworths.*
Steak and vegetables — Cost $47.15 or $11.80 per serve.
Roast chicken and vegetables — Cost $32.70 or $8.15 per serve.
Spaghetti bolognese — Cost $25.60 or $6.40 per serve.
We could add to that uni student specials …
Fried rice with egg and spring onion — Less than $12.00 or $3.00 per serve
Two minute noodles - Still about $1.50 per serve.
It is far cheaper to cook for yourself than to buy takeaway, let alone to dine at restaurants.
While I love to cook this is not a hippie DIY pep-talk.
The industry provides a beautiful example of two of the forces that are suppressing productivity growth in the Australian economy, both of which are driven by consumer choices.
FAST FOOD USED TO BE MUCH CHEAPER
‘Twasn’t always so. The comparative price levels today reflect very different rates of price change over recent decades.
The entire consumer price index basket increased by 93% since the start of the century. During the same period, food prices have increased:
87% for store-bought food (that is, it has become cheaper compared with the whole bundle of goods and services that households typically buy, because the price of most services in the bundle has increased faster)
108% for restaurant meals
122% for fast food and takeaway
179% for a Big Mac.
CHANGES IN THE PRICE OF GROCERIES AND COOKED MEALS
Consumer Price Index Components, March 2000 = 100

Source: 1hand calculations based on ABS 6401.0, 6440.0; and The Economist.
The flipside of prices is productivity. When productivity in an industry rises, competition between businesses drives prices down. When productivity in an industry falls, competition drives prices up.
The standard measure of productivity in the economy is the output produced per bundle of labour and capital inputs across the market sector of the economy. Health, education and public administration are omitted from the market sector because their productivity is too hard to measure accurately.
Market sector productivity has increased 13% since 1999-2000. This is an anemic pace by historical standards, though other countries have also experienced slow productivity growth over this period.
Productivity in accommodation and food services, which includes both restaurants and takeaway, grew 17% over the same period, about the same as the average across the market sector.
Productivity in retail trade, which includes food retailing such as supermarkets, butchers, bakers and so forth, has risen 33% over the same period. That is, productivity improvements in supermarkets and other grocers has increased much faster than the average across the market sector, placing downward pressure on retail prices.
MULTIFACTOR PRODUCTIVITY BY INDUSTRY
1999-2000 = 100
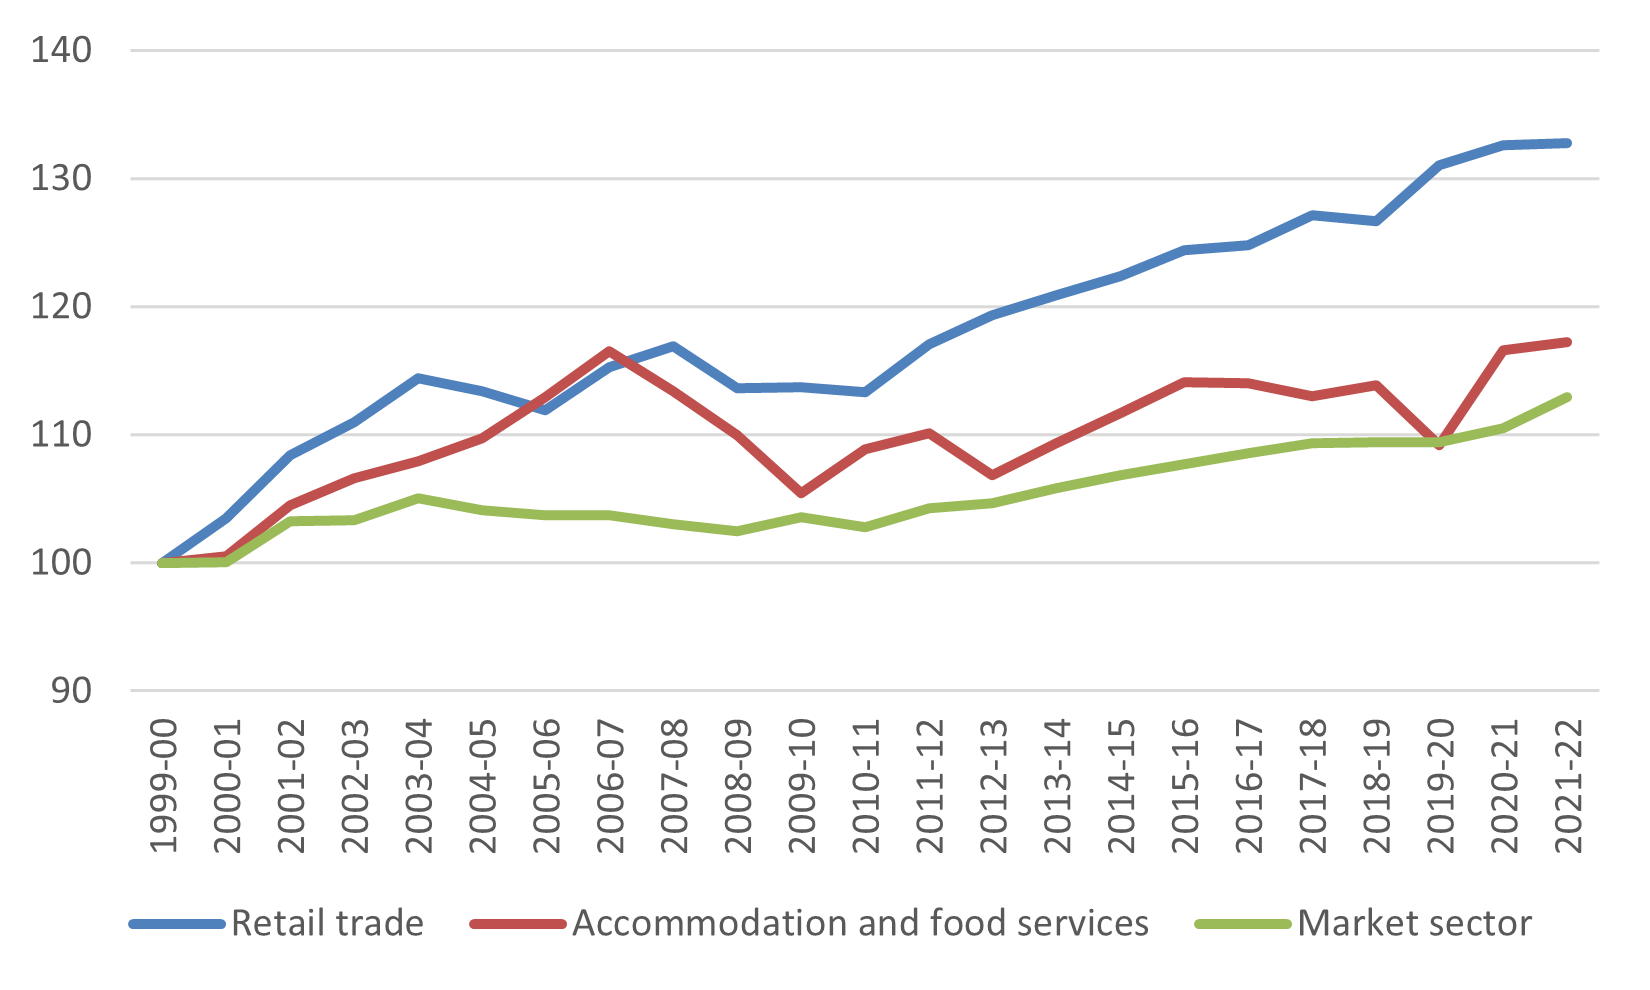
Source: 1hand calculations based on ABS 5260.0. Figures are for gross-value added based measures using hours worked as the measure of labour input.
How can this be so?
How can fast food have maintained its hold on the household budget when prices have increased so much in the past two decades? How can spending on restaurants have increased so much over the same period despite rising prices?
Two things.
THING 1: BAUMOL’S LONG SHADOW
In 1826, when Beethoven’s String Quartet No. 14 was first played, it took four people 40 minutes to produce a performance. In 2010, it still took four people 40 minutes to produce a performance. Stated differently, in the nearly 200 years between 1826 and 2010, there was no growth in string quartet labor productivity.
Source: Why Are The Prices So Damn High?
Yet, violinists are paid far more than they were in 1826. About 23 times more in 2010, in nominal terms.
Zero productivity improvement. 2300% increase in wages?
The idea here is ‘unbalanced growth’ as set out by William Baumol in 1967.
There are some parts of the economy (e.g. agriculture, manufacturing or mining, among other sectors) that achieve strong productivity growth over long periods of time. There are other parts of the economy (e.g. restaurants, hairdressing and many services that involve face time) that achieve weak productivity growth over time.
While firms are driven to improve productivity by a desire to make profits, when the average level of productivity improves in an entire industry, competition drives their sale prices lower relative to other prices in the economy. Consumers are the main beneficiaries.
Take ICT manufacturing. It was to the 1980s, 1990s and early 2000s what textile manufacturing was to the Industrial Revolution, what electrification and the internal combustion engine were to inter-War growth and what AI will be to the next few decades.
Here’s a simple chart that plots productivity against the price of output in ICT manufacturing. Over a quarter century, and taking account of quality improvements, productivity rose by a factor of almost 8 while prices fell by a factor of almost 7.
The overwhelming majority of the gains from productivity improvement were delivered as benefits to consumers in the form of lower prices.
PRODUCTIVITY GAINS ALMOST PERFECTLY MATCH PRICE FALLS
US manufacturing of computer, electronic, optical products and electrical equipment, 1995=100, log scale

Source: 1hand calculations based on EU-KLEMS. Data are for value-added price and TFP concepts.
Suppose you are a manufacturing worker being paid the marginal revenue product of your labour. Manufacturing productivity has doubled, but the price of your output has halved, and your nominal wage is unchanged. Let’s assume that there is no productivity improvement in service industries.
Your real, inflation-adjusted wage has risen becase the price of goods you consume has fallen.
The staff at your local restaurant have acheived no productivity improvement. Nevertheless, they share your improvement in real income because:
the cost of goods they consume has also fallen
the local restauranter can’t lower their wages because then staff may leave to become manufacturing workers in the medium term.
The size of the restaurant industry may grow or contract …
Goods have become cheaper relative to services and so maybe you want to buy more goods and fewer services? Economists call this the price substitution effect. It will tend to reduce the size of the restaurant industry.
Your real income has increased so you can afford to buy ‘luxuries’ that you couldn’t afford before. Maybe you should buy more takeaway instead of cooking yourself, or more restaurant meals instead of takeaway, or indeed attend a string quartet? Economists call this the income effect.
What has happened over the past couple of decades is that the income effect has dominated the price substitution effect.
Fast food and restaurants have seen weak growth in productivity over recent decades and as a result their prices have risen relative to store-bought food. Yet the share of household consumption spent on them has remained steady in the case of fast food and risen sharply in the case of restaurants.
Australian households have become far richer, on average, over the past couple of decades. Higher incomes mean that people are able and willing to spend far more on cooked meals. And what’s more, the strongest growth has been in the more expensive restaurants category … people have been able to afford to treat themselves. Fast food and takeaway is ‘the man in the middle’: with rising incomes, some people have been able to afford more fast food and less home cooking, but some other people have been able to afford more restaurant meals and less fast food.
The CGE modellers among us find these results to be trivial. It’s the set of ideas they work with every day. But William Baumol’s general equilibrium relationships are still rarely taught in either core micro- or core macro-economic undergraduate courses.
In trade economics, this is taught as the Balassa-Samuelson effect. Consumer prices of services are generally higher in richer economies than in poorer economies. That is, it’s far cheaper to get a haircut in Vietnam than it is in Australia not because of differences in hairdressing skill, but rather because the outside employment option for the hairdresser (for example, working in manufacturing, mining or agriculture) would pay far more in Australia than in Vietnam.
Baumol’s contribution was to note that over time, some industries with very low productivity growth may grow as a share of the economy because of income effects.
THING 2: VARIETY IS NOT MEASURED AS A QUALITY IMPROVEMENT
Ask any Russian, ‘do you like dressed herring?’ and they will say ‘yes, yes, I love dressed herring so much!’. I understand it is a complete piece of shit.
Vladimir Muhkin, Chef, White Rabbit, Moscow.
For 75 years in the USSR, standard food offerings were set out from a state-approved cookbook.
In The West, the #1 rule of marketing is a bit different: segment your market. Some people are happy to pay for vanilla icecream … others are willing to pay more for chocolate icecream. Some are willing to pay more to sit in the pointy end of the plane … others refer to it as ‘the crumple zone’.
To make money you need to differentiate your product and price according to consumer preference. Extract every last cent of consumer surplus. Treat each customer as if they are special …
Returning to the menu of that first McDonald’s Restaurant opened in Australia in 1971: burgers, fried chicken, fried chips, fried fish, coleslaw and apple pie. A bunch of deep fryers, some grill elements, bulk-produced salad. High-efficiency food production at low prices. By 2000, that burger-first model had been perfected from an engineering perspective.

Skip forward to a modern McCafe and there is far more focus on making the consumer feel special. Potentially you are looking at a menu that includes:
12 different beef burger offerings
12 different chicken and fish offerings
McNuggets and McBites (a link in case you were wondering what the difference is because I was)
5 happy meals
5 toasties
2 toasted breakfast breads
14 coffee or coffee-like beverages (many of them frozen).
And it goes on.
That’s a lot of inventory to carry and a decent chunk more staff training for them to be flexible across all stations.
McDonalds menus have expanded to meet the demands of parents, while kids still love the Big Mac. But in the process, the diseconomies of scope mean that everything costs more to produce than it did back when the menu was simple.
Changing the menu to meet consumer needs is a good thing.
Yet, none of these improvements in customer experience through variety are measured as productivity improvements by national statistical offices, but rather the increase in costs is measured as a productivity loss.
Diseconomies of scope aren’t limited to fast food.
El Bulli, five-times voted the greatest restaurant in the world in the noughties, had 1800 different dishes. (Who knew you could improve peas by turning them into pea soup and then immersing it in a gelling agent so they look almost exactly like peas again? Genius.) It made losses year in year out, that were propped up by book sales and chef speaking engagements. Eventually they closed, overcome by the weight of their scope. And yet both diners and chefs adored every minute of it, and the legacy of their creativity lives on in restaurants across the globe. Variety was the business.
The sharp increase in overall spending at restaurants in Australia is a loss of productivity for the same reason. We dine Basque one night, Nordic another and Thai the next. The variation in product is what makes it so damn good for our souls.
We still measure restaurant productivity as if each restaurant were cooking to a common USSR cookbook and ignore when the benefit they provide is by expanding variety.
SUMMING UP
Productivity growth in restaurants and fast food has been weak. Yet by and large we have bought more of their food each year. Partly this is because our incomes have risen and we can afford to splurge, and partly it is because our incomes have risen and we can afford to buy a variety of food offerings both within and between restaurants.
The industry has responded to consumer choice. That’s a good thing, even if sometimes it is productivity reducing.
The clearest path to strong productivity growth is changing policies that inhibit productivity in areas like infrastructure, education, the use of big data, health and so forth. More to come on productivty reform in those areas.
And the inner hippie in me says: learn to cook, it will change your life.
* Wonknote: To Woolworths fulfillment costs, we add a notional $5 per home-cooked meal for four people. This is intended to cover cooking oil, salt, pepper, the energy costs of cooking and cleaning (maybe $2 a day?), the loss of an occasional plate here or there (maybe $1 a day?), the cost of turning over frypans (I spend about $1 a day on this notwithstanding ‘lifetime’ warranties) and anything else that arises (e.g. low risk of a local spot fire that requires repairs, lets say $1 a day, and yes I have done that). We add $2 per meal to the simpler ‘student specials’.
I found this article really informative, particularly the concept of diseconomies of scope, clearly revealed in the improved fast food menu choices over time, an aspect not revealed in productivity measures in hospitality. Which links nicely to an earlier blog "Productivity, or how to widen the long and narrow path" where it was revealed that hospitality was a key contributor to labour productivity slowdown, summed up nicely above "The industry has responded to consumer choice. That’s a good thing, even if sometimes it is productivity reducing."
Excellent analysis on the relative price changes between fast food, restaurants, and home cooking. The productivity story makes good sense as an explanatory factor.
That prompts an interesting tangent about McDonald's burger prices. I too have loosely assumed McDonald's earns minimal super-normal profits overall. However, right now the McDonald's app shows Big Mac combo prices of $7.45/$12.85 and $7.10/$12.40 at two locations less than 20km apart in Victoria.
This variance raises some questions. Do input prices (rents, wages, transport) differ substantially between these nearby stores? Or is it that willingness to pay is higher in some spots, moving the location up its own supply curve? Might it simply be noise from individual franchisees' operations?
While not directly about productivity, it relates. 'Productivity' as we economists define it is an attempt at a useful simplified statistic, but necessarily glosses over real-world complexity. Comparing those two outlets' productivity statistically (and this is a critique of some of the productivity-style analyses using microdata) would likely be very time-sensitive, rely heavily on assumptions embedded in the analytical framework, and be a function of the purposes for which the data was actually collected.