


PRODUCTIVITY, OR HOW TO WIDEN THE LONG AND NARROW PATH
A productivity explainer and commentary on its relevance to interest rates

(Wonkish. TL; DR Much of the unprecedented fall in labour productivity over the past year has occurred within industries in which output growth is hard to measure, which should cause an eyebrow to raise when considering how much it matters.)
RBA Governor Phil Lowe, he assures us, is treading a narrow path.
I like to imagine him leading a trek along a poorly flagged path, high in the Himalayas.
On one side is a deep ravine which, if he were to stumble, would plunge hundreds of thousands of fellow trekkers into unemployment. Some Australians would exit the labour force permanently. Economists call that side of the path a recession.
The other side is slightly less precipitous, but if he slips he will take the whole country with him, condemning all of us to years of high inflation which erodes savings, distorts investment and often falls more heavily on the poorest because they spend most of their income on non-discretionary items and have little budget flexibility.
Either way, climbing out would take years.
At the front is Phil, taking it one step at a time and you had better hope he packed his crampons.

The June interest rate rise: what’s productivity got to do with it?
The latest rate rise came as a surprise. Treasurer Jim Chalmers noted that ‘many people will find it difficult to understand and difficult to cop’.
Central bank watching is an industry in its own right. In the 1990s, market economists monitored the width of then US Federal Reserve Chairman Alan Greenspan’s satchel on the assumption that more thickness meant more briefing to support a more marginal decision whether or not to raise rates. He revealed in his memoirs the causal variable was, instead, whether he was packing lunch.
I’m not a central bank watcher, so I’ll just give you the background from Phil’s most recent speech necessary for me to talk about the role of productivity.
Inflation has been running at or about 7% on a year-ended basis for about 12 months now. There are early signs that it may have peaked at 8.4% in the year to December 2022, but the slowdown has been modest.
Inflation occurs when more money chases fewer goods. This can happen due to disruptions to the supply of goods (for example the energy price shocks stemming from the sanctions on Russia after its declaration of war on Ukraine), or because businesses, households and governments are spending more (for example because businesses are bullish about potential returns on investment in a growing economy, or because households are feeling confident consuming in a low unemployment environment).
Since 1992, governments of both stripe have agreed with a succession of RBA governors that they should aim to keep inflation within a target band of 2 to 3% per year on average over the business cycle.
There are only two ways to lower inflation back to the target band: lower expenditure by households, businesses and governments (that is, less demand); or increase productivity (that is, more supply).
(As an aside, the third way that governments can lower measured inflation is by paying businesses to discount their prices, as in the Energy Bill Relief Fund announced in the most recent Commonwealth Government Budget … but that’s a statistical sleight-of-hand ... a government may just as well lower inflation by directing the bureau of statistics to publish lower numbers … I’m sure some other countries’ governments do precisely that.)
Best to cite Phil Lowe directly:
‘The path back to 2–3 per cent inflation is likely to involve a couple of years of relatively slow growth in the economy.’
‘Unfortunately, growth in productivity has been weak over recent times. Indeed, the level of output per hour worked in Australia today is the same as it was in late 2019. This means there has been no net growth in productivity since then.’
‘In recent times, unit labour costs have been increasing quite strongly. Over 2022, they increased by around 7½ per cent, which is one the largest annual increases during the inflation targeting period. While the causation with inflation runs both ways, ongoing strong growth in unit labour costs would underpin ongoing high inflation outcomes. The best way to achieve a moderation in growth in unit labour costs is through stronger productivity growth, which would also underpin durable increases in real wages and our national wealth and make more resources available to fund the public services that people value.’
‘Productivity growth was slowing before the pandemic and it is entirely possible that the disruptions caused by the pandemic made things worse. Many firms had to focus on survival, rather than growing their business. Supply chains were interrupted, there was both labour hoarding and labour shortages, investment was delayed and finance tightened up. None of this was helpful for productivity growth… [the] uncertainty here, is what comes next.’
‘What is critical are the trends over time, not the outcomes from quarter to quarter. At the aggregate level, wages growth is consistent with inflation returning to target provided that trend productivity growth picks up. Given the importance of this issue and the increased risks on this front, the Board will continue to pay close attention to trends in productivity growth and their implications for the sustainable rate of growth in nominal wages.’
The economy has slowed sharply and productivity is looking unusually, even weirdly, sick: at -4.5% over the year to March 2023, it is the lowest outturn for GDP per hour worked since the data series began in 1978.
Real GDP and GDP per hour worked, year-ended % change

Source: 1Hand calculations based on ABS 5206.0.
Enter labour productivity growth
Labour productivty is a measure of the extent to which volumes of output grow faster than hours worked (more detail is in the references below). The most complete measure of labour productivity in the economy is GDP per hour worked.
Over long periods of time, labour productivity is the source of growth in real incomes, generally measured as GDP per capita. It is the means to simultaneously raise wages to relieve cost of living pressures (Treasurer Chalmer’s focus) and lower inflation (Governor Lowe’s objective). That is, boosting productivity would widen the path that Phil is seeking to tread.
Labour productivity and GDP per capita since Federation
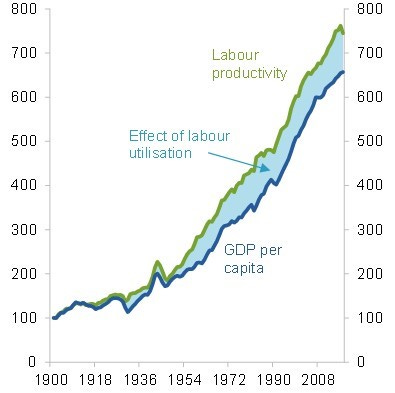
Source: Productivity Commission Productivity Inquiry Interim Report.
Over the course of a year or a few years, productivity is more difficult to decipher.
One reason for this is that productivity varies with the business cycle: for example, during downturns employers may keep on good and loyal staff even though there isn’t enough work to keep them fully occupied, taking a hit to labour productivity in the process.
A second reason is that hours worked data are noisy from quarter to quarter. This is particularly a problem at the industry level where the ABS relies on households to self-identify the industry they work in. [Reader: could you tell the ABS whether you work in wholesale trade, or instead in transport and distribution?]
But whether over short or long periods, productivity is difficult to measure accurately because output is very difficult to measure accurately in many industries.
Suppose you are a lawyer. It’s easy enough to measure your output at a point in time by looking at your income and substracting off your input costs. This gives you what statisticians call ‘nominal gross value added’ and what the rest of us call nominal output. It is relatively easy for the ABS to measure based on business surveys.
But how does your volume of output compare with 12 months ago? Perhaps you are bringing in more revenue from clients. But is that because you are servicing more cases or more difficult cases — reflecting your growing stature in the industry and skill in the profession — or simply because you increased your fee structure. And how well can the bureau of statistics tell the difference between the change in the quality-adjusted quantity of output you produce from a mere change in the prices that you charge your clients?
Legal services are an example of an industry where the growth in the volume of output is hard to measure from one quarter to the next.
Measurable and non-measurable productivity growth
The Australian Bureau of Statistics was a world leader in introducing industry productivity measures in the 1990s. It still is one of the most reliable and impartial statistical bureaus worldwide. It’s an institution whose value to good public policy making cannot be overstated.
At that time, they considered output was adequately well measured (separately from counting inputs) in 12 industries to permit meaningful calculations of productivity. These days they consider this is the case for 16 of 19 industries.
But the methods for measuring the volume of output vary significantly. For example, it can be based on a unit of material production (tonnes of iron ore, and coal, and so forth leaving the mine gate), or on nominal production deflated by an estimate of price changes (our lawyer situation above).
Or it could be based on only very limited measures of output volumes. In three industries (public administration, education and health care and social assistance), the ABS considers that productivity measures are unreliable.
Below is my subjective assessment of the reliability of industry productivity numbers after two decades working with the data.
The reliability of output estimates varies by industry

Source: 1hand analysis
Why has productivity growth been the weakest ever recorded?
A good way to make progress on understanding productivity trends is to work out which industries are driving the overall outcomes.
Industries affect GDP per hour worked:
because of changes in labour productivity within an industry, and
because of movements of workers into relatively high productivity industries (which would add to GDP per hour worked) or into relatively low productivity industries (which would subtract from GDP per hour worked.
The first is called the ‘within industry effect’ and the second the ‘between industry effect’. For the particularly wonkish reader, we use a Tornqvist decomposition in this post, with details provided in the references below.
Within and between industry effects on GDP per hour worked
Year-ended percentage change
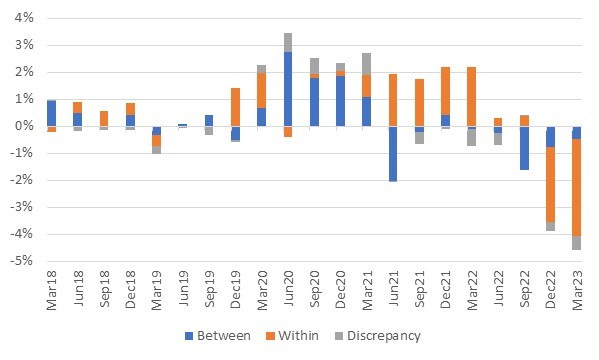
Source: 1Hand calculations based on ABS 6150.0 and 5206.0.
A large majority of the recent decline is due to declines in productivity within industries, rather than movements of labour between industries. And so the search must continue to see which industries’ plummeting productivity are driving the movements.
Let’s focus in on movements over the past year.
Industry contributions to growth in GDP per hour worked, year ending March 2023.
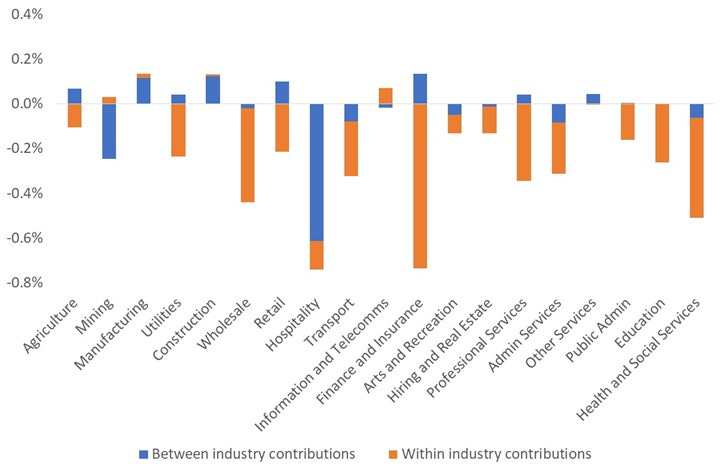
Source: 1Hand calculations based on ABS 6150.0 and 5206.0.
Running industry by industry, two outcomes are obvious.
Productivity has fallen steeply within finance. The majority of industry output is measured as FISIM (Financial Intermediation Services Indirectly Measured). Intuitively this is a measure of the spread between the loan book and depositor book taking account of the difference in interest rates between the two. But the price of FISIM is notoriously difficult to measure. More to follow in a future post.
GDP per hour worked has fallen because of the movement of workers between industries into the hospitality industry (accommodation, cafes and restaurants) which has a low level of labour productivity. Hours worked in the industry are up 26% in the year to March 2023 (albeit only up 7% from pre-COVID levels) as the industry has bounced back to life. This seems like a solid read.
What to make of the rest of the data? I spoke earlier about difficulties measuring output. These difficulties plague the calculation of productivity changes within industries (which rely on estimates of volumes of output over time) much more than they do calculation of the contributions due to movement of labour between industries (that only rely on estimates of the value of output and so are generally solid).
So let’s dig a little deeper on the productivity changes within industries.
Contributions to GDP per hour worked from labour productivity changes within industries, year ended March 2023

Source: 1Hand calculations based on ABS 6150.0 and 5206.0.
What is noteworthy is that the industries in which productivity is most accurately measured have contributed only modestly to the sharp fall in GDP per hour worked.
Moreover, a full 0.87 percentage points of the fall in GDP per hour worked is contributed by industries for which the ABS eschews productivity analysis because the calculations are unreliable.
To sum up, it is clear that labour productivity has fallen over the past year and understanding why that has occurred industry by industry is worthwhile work to inform policy considerations. Nevertheless, the idea that Australia has just experienced the largest fall in GDP per hour worked in the history of the data series should be taken with a grain of salt.
Further reading: How to improve productivity
When Glenn Stevens was RBA Governor and was asked how to improve productivity, his response was: ‘The Productivity Commission has a list of things to do. Go and get the list and do them.’ More to follow in future posts.
Some resources:
References
A primer on productivity, p.7.
Tornqvist decompositions, p.78.